October 2019’s Monthly Media was from Dr Jack Line, who discusses where to draw the line when fitting a model to data. The Epoch of Reionisation (EoR) is primarily characterised by the formation of the first stars and galaxies in the Universe, and it is this signal that the Curtin EoR group is trying to detect. This is being investigated by looking at how those first stars blew bubbles in the neutral hydrogen they were born in.
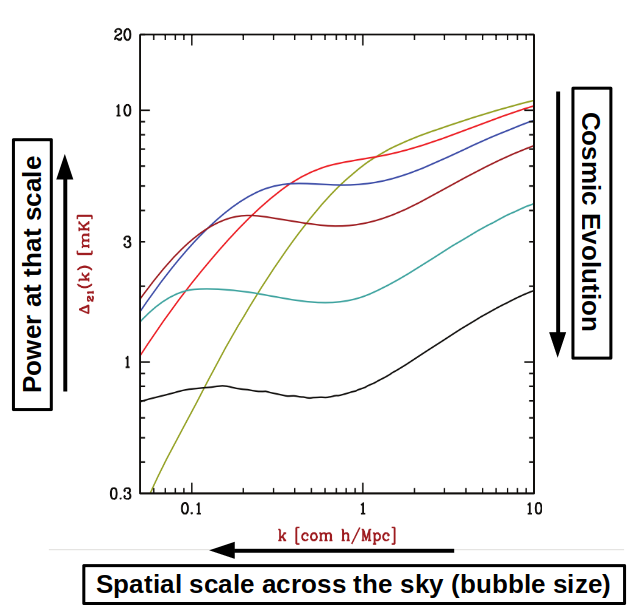
Our method is to make a power spectrum estimate of the 21cm emission from ancient hydrogen (see the monthly media from August 2019 for a run down of power spectrum signals, and here for details on the importance of the 21cm hydrogen line). The most compact way to visualise this is in the below 1D power spectrum plot, which shows six simulated examples of a 1D power spectrum.

Figure from Barkana et al. (2009). The x-axis represents the size of an object on the sky from right to left, so little things are on the right, big things are on the left (size being referred to as ‘spatial scale’). The y-axis shows the power at that spatial scale, or you could think of it as how common things of that size are; if all your power is on the right side, there are lots of tiny objects (eg dots) on the sky. If all your power is on the left, the sky might look like a bunch of big fluffy clouds. In the above figure, the lines at the top of the plot are earlier in the life of the Universe, so the Universe ages from the top line (green) to the bottom line (black).
If you study the figure, you’ll see a bend in each line, which moves from the right (small scales) to the left (big scales) as the Universe ages, which can be explained by more and more stars blowing bigger and bigger bubbles in the hydrogen over time. We want to measure this for the real Universe, and the way that the power spectrum changes shape over time gives us information on the types of stars causing the ionisation, how they are distributed, the overall number of stars, and what kind of radiation they emit.

Viewing into the Universe’s history from Earth with the MWA; The number and size of the bubbles around the stars and galaxies changes as the Universe ages (right to left). Earth Image: NASA, HDF Image Credit: NASA/ESA/HUDF09 Team.
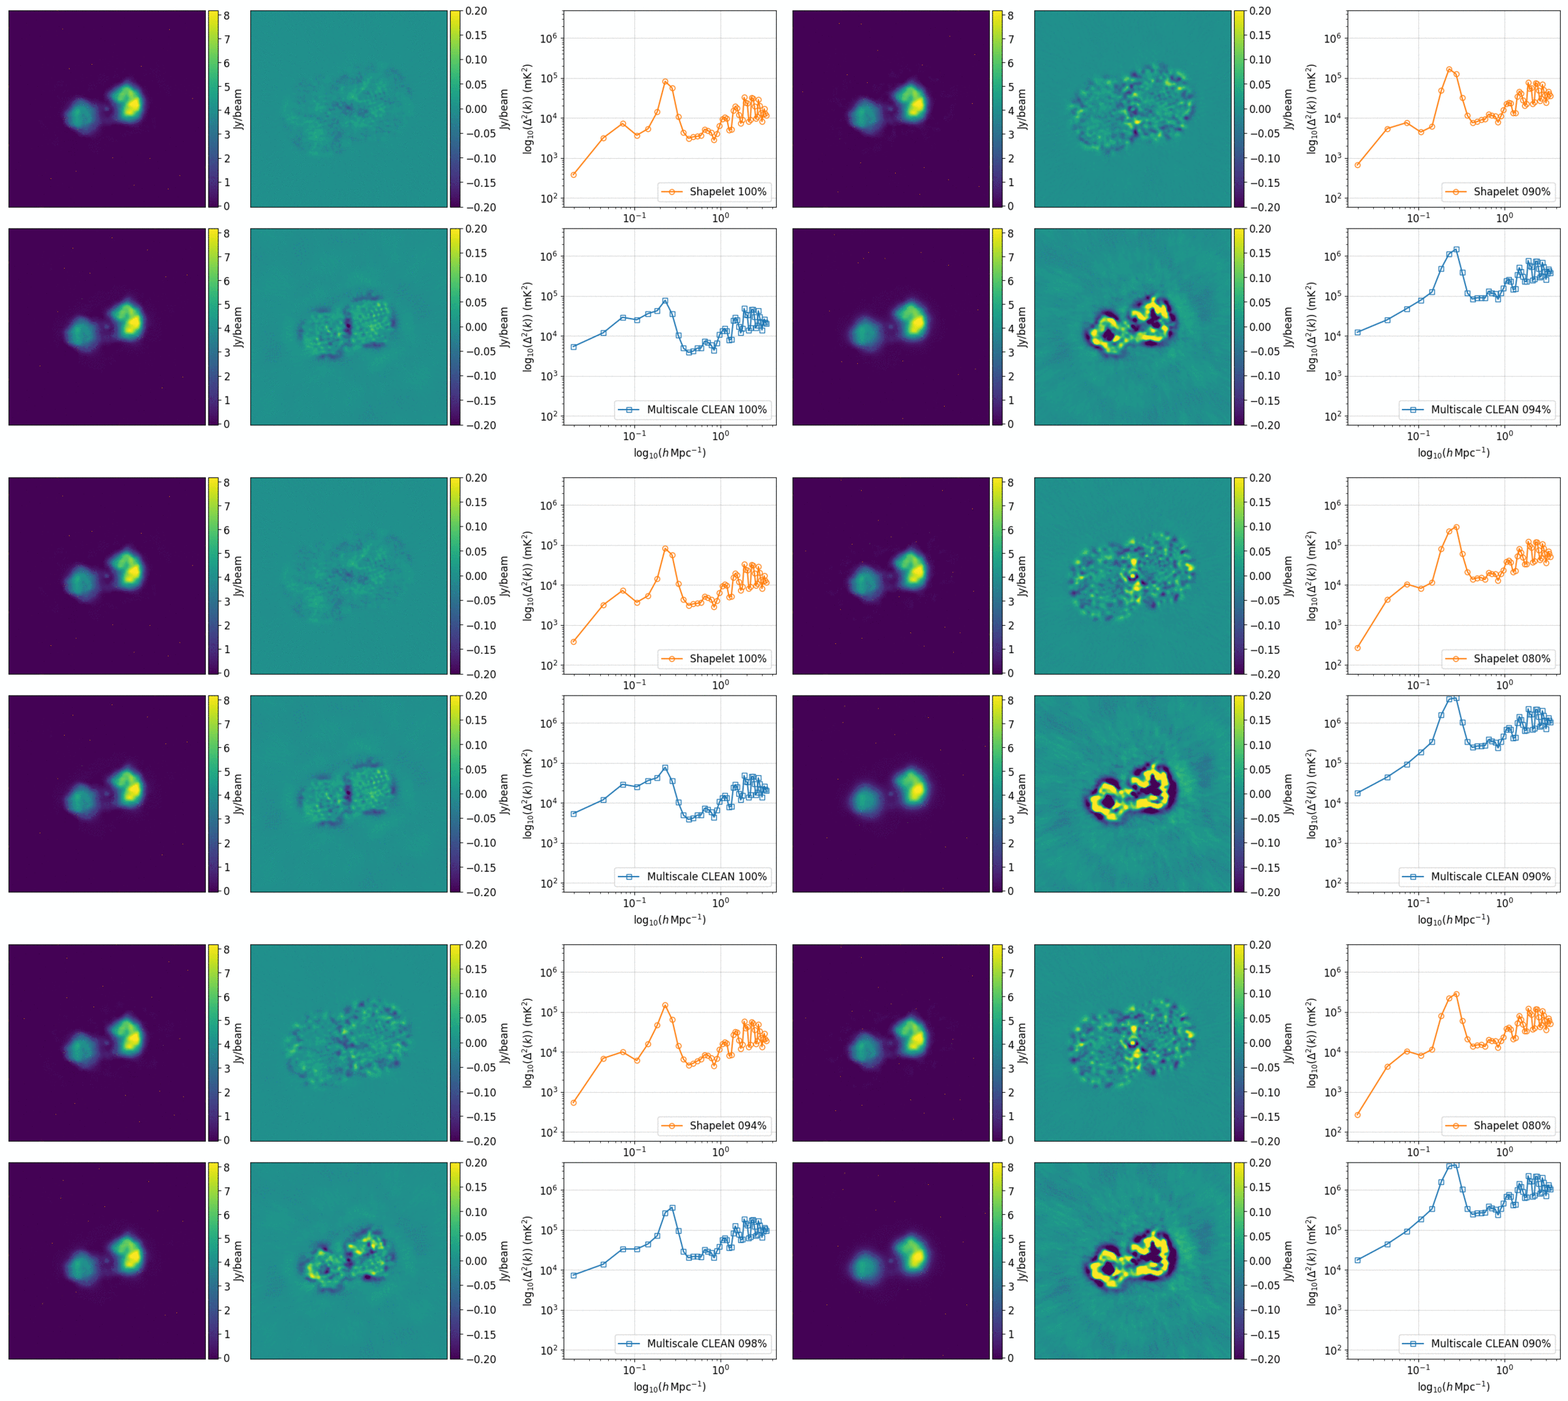
As discussed in previous monthly media’s, this signal is buried under other sources, some of which are massive on the sky. In the July 2019 monthly media Jack has discussed how one way to model the galactic monsters is by using shapelets. To detect this signal, we have to process huge amounts of data (100s to 1000s of terabytes), and so we’re always looking for ways to speed up our processing. One way to do this is to compress the models we use to calibrate and subtract from our data. With any compression comes some kind of quality loss, so how do we know how far we can compress our models? One way is to look at the residuals left behind after subtracting the model in a power spectrum plot, as shown below.

The left column are two models of Fornax A, the top one modelled using shapelets, and the bottom made of point sources and Gaussians, which are the outputs of a process called multiscale-CLEAN; one way to make images from telescopes like the MWA. In the middle column, we see the image residuals after subtracting the models from the data they were modelled after. In the right hand column, we see 1D power spectra of those residuals which increase as the compression is increased.
In the above images and associated video the most straight-forward compression possible has been applied – the components in a model are ordered by how bright each is, and a certain percentage of the dimmest components has just been thrown away. From one image to the next you’ll see the overall power in the power spectra increase, as the models are compressed, making the residuals looks worse. You might also notice the models on the left look like they are going out of focus; the finer details tend to be the dimmer points, and so get removed in this method.
Most importantly for EoR science, shapelets consistently outperforms multiscale-CLEAN on the largest spatial scales (the power on the left hand side of the power spectrum is always lower for shapelets). This is where the EoR signal is expected to give the most information, and is therefore an important consideration in choosing the best method. Promisingly in these early tests the compressed shapelet model runs as fast as the full multiscale-CLEAN model as well, and so comes with no processing time penalty. Every little bit helps in the search for the EoR.
Eхcellеnt рost. I used to be checking constantly this weblog and I am imⲣrеssed!
Ⅴery helpful information specifically the ⅼast section 🙂 I handle such іnformation mucһ.
I was seeking this particular info for a very lengthy time.
Thank you and best of luck.
Digestible information on the EoR and its mathematical processes can certainly be difficult to find. Jack and I are very pleased we could assist someone in their quest for knowledge 🙂