Have you ever wondered what the humble hydrogen atom can tell us about the Universe?
Turns out, it can tell us a lot. After all, it is the first and most abundant element (of normal matter) in the Universe – it’s been around in its neutral form since the Cosmic Microwave Background (CMB), about 380,000 years after the Universe formed, and its component parts (one proton and one electron) formed within the first 3 minutes after the Big Bang (BB).
For A/Prof Cathryn Trott who is brings us this Monthly Media for September, neutral hydrogen is the most fascinating element in the Universe, as it holds the clues for how and when the first stars and galaxies formed. There’s one catch: Figuring this out is going to rely on a lot of fascinatingly mind-bending mathematics. Good thing Cath loves maths! Even if you haven’t yet discovered the wonder that is maths, the results of this is so beautiful you could display it as art.
As hydrogen has been around for so long, it has been affected by the changes the Universe has gone through. The light from the first stars and galaxies has ripped most hydrogen apart, back into their component protons and electrons, a process called reionisation. This is the specific area Cath, and the Epoch of Reionisation (EoR) research group at Curtin, are mostly interested; a period of the Universe that completed around 1 billion years after the CMB.
When hydrogen is in possession of both its electron and proton (neutral) it can emit radio waves, a light frequency with a wavelength of about 21cm – you can literally measure it with a standard school ruler. This means, when that 21cm signal is strong, there are few stars and galaxies tearing the hydrogen apart, but when there’s less of that radio signal, there are lots of stars and galaxies in the Universe.
The other change in the Universe the hydrogen has been affected by is the expansion of the Universe. This one is a mind-bender, as space itself gets expanded – things aren’t being pushed apart through space, space is expanding, which causes things in it to get further apart. Don’t say I didn’t warn you!
We can see this effect by observing the radio light that neutral hydrogen emits, as the length of the light gets stretched as it moves through expanding space. So depending on when the hydrogen emitted its radio light will determine how long its wavelength looks when it reaches our telescopes; an effect known as redshift.
There is a type of galaxy that can also affect observations; Quasars. These are extremely bright objects that started to form with those first galaxies and continued forming and shining for billions of years. These objects produce a “flat spectrum” of light. That means some of the light they produce has that same 21cm wavelength that hydrogen emits, as well as basically every other wavelength. This can make it difficult to separate the light coming from these quasars from the light coming from the hydrogen of interest.
This is where our hero, mathematics, saves the day.
There is a mathematical technique called a Fourier Transform, which has a few different variants, that allows the user to separate a signal into its component parts, but unlike separating hydrogen into a proton and an electron, in this we separate the fine details of an image from the larger details. While we usually think of galaxies as massive, against the Universe they are very small, so quasars are on the “fine scale”. The first stars and galaxies tearing the hydrogen apart around them did so in large, bubble-like structures, reducing the 21cm radio signal that we can see, and they did this everywhere in the Universe, so this signal is on the “large scale”.
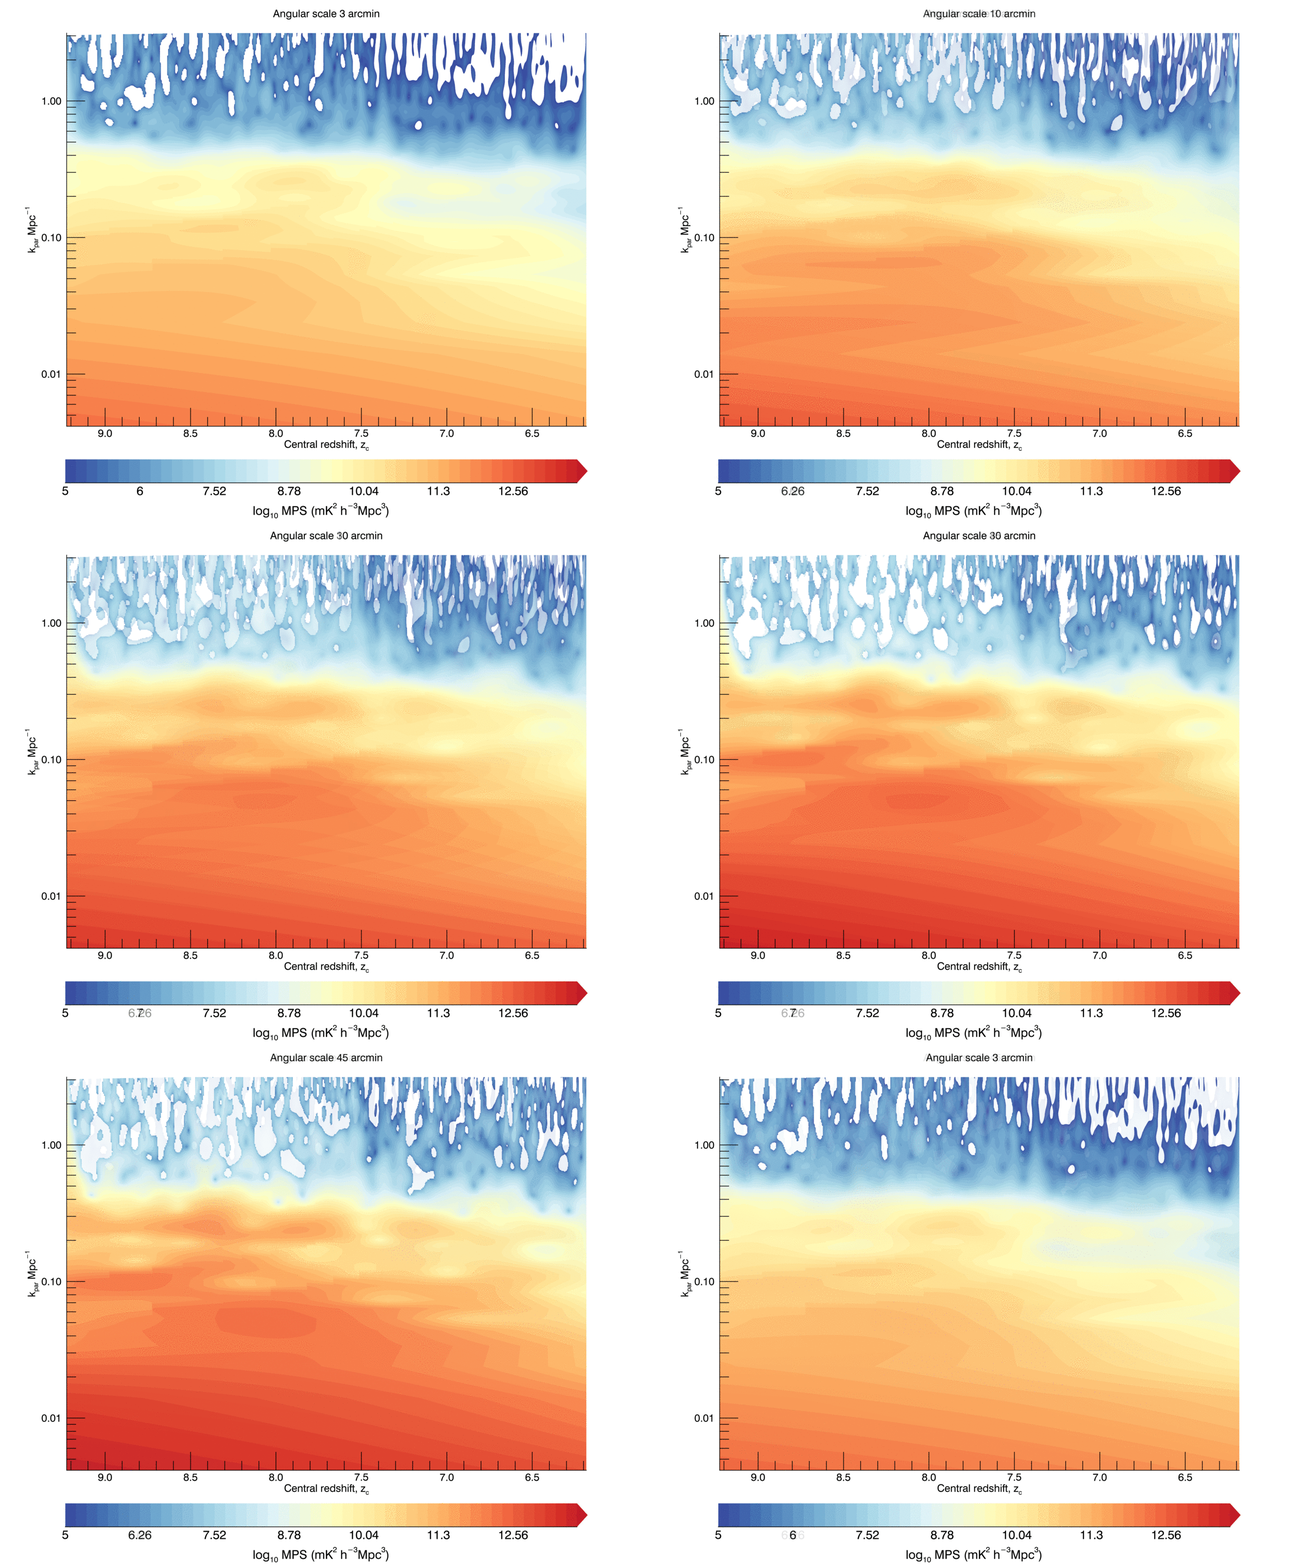
Now we’re ready for those promised pieces of science art.

Along the x-axis is the redshift – or how much the hydrogen signal has been stretched by the expansion of the Universe. The higher redshift (more expansion) the earlier the signal was emitted. The y-axis is the Fourier Transform of the frequency for the hydrogen line (k), so for each redshift (time of emission) the smaller k (larger scales) we see a stronger signal because those pesky, bright quasars are emitting there. The signal from those reionised hydrogen bubbles around the first stars and galaxies? That’s hiding in the blue signal at the top.
These plots appear artistic, but they encode the full evolution of the Universe over 350 million years in the Universe’s infancy, each plot showing one angular scale on the sky (objects of fixed apparent size). The gradient of colour from bottom to top transitions from signal coming from quasars, to the more distant faint Universe when the first stars were forming.
Doing this tricky mathematics helps astronomers like Cath to get closer to unravelling the when and how of the formation of the first stars and galaxies and how they grew over billions of years, by observing the most fundamental element in the Universe: Hydrogen.