This month’s media is from Dr Jack Line, who is comparing quality against quantity in the search for one of the oldest signals in the Universe; the Epoch of Reionisation (EoR).
To find this signal requires “digging” through data, and removing thousands of foreground radio sources that are in the way. First up, a game of spot the difference:
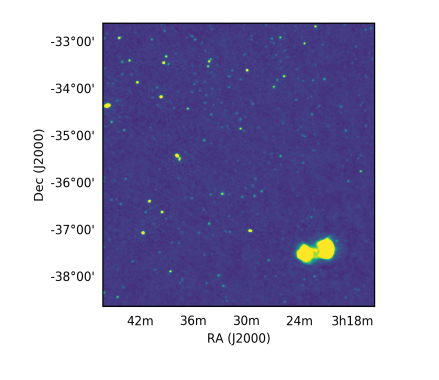
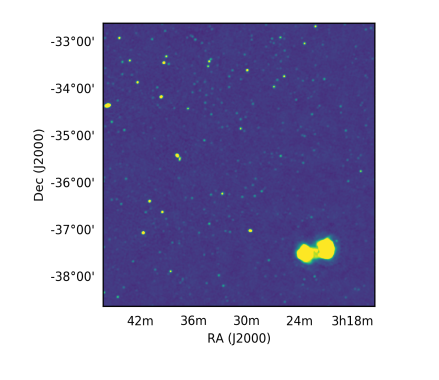
How many differences did you find? Hopefully not too many, as scrolling to the right reveals a real image of radio sources on the sky (the the Murchison Widefield Array (MWA) telescope), and scrolling to the left reveals a simulation of that real data, created by the WODEN package. You can see the bright radio galaxy Fornax A in the bottom right of the image.
It may be difficult for the human eye to spot any differences, but due to small inaccuracies in the model, and affects of the Earth’s atmosphere when an observation is made, the two images will never be identical.
This makes it difficult to reliably remove the foreground radio sources while leaving the EoR signal intact.
One method is to focus on removing the brightest 1,000 foreground objects, in a process called peeling. This process is computationally costly, so anymore objects than that and the computer says “No”. Despite that drawback, it is very accurate in removing sources because it takes the model as a guideline only, and is able to find the actual location, brightness and size of the radio source in the image, which may be different to the model for any number of reasons.
Another way to approach it is to model many more sources and instead of spending the computational power finding exactly where those sources are in the image, to simply remove what you expect to be there. This has the benefit of removing many more radio sources with the downside that there are more inaccuracies in their removal.
The below image compares the original MWA data with what is left of the data in both processes of removing the foreground radio galaxies. Straight off there are some nasty left-overs on the right-hand source removal that look like “holes”, where the simple subtraction has failed, either due to the atmosphere messing with the image, or having a bad model for that source. However, the simple subtraction, on the left-hand source removal, has removed thousands more sources than the peel on the left. This is important, as the EoR signal is in every direction on the sky (in every pixel of this image), and so the more you can subtract the better.

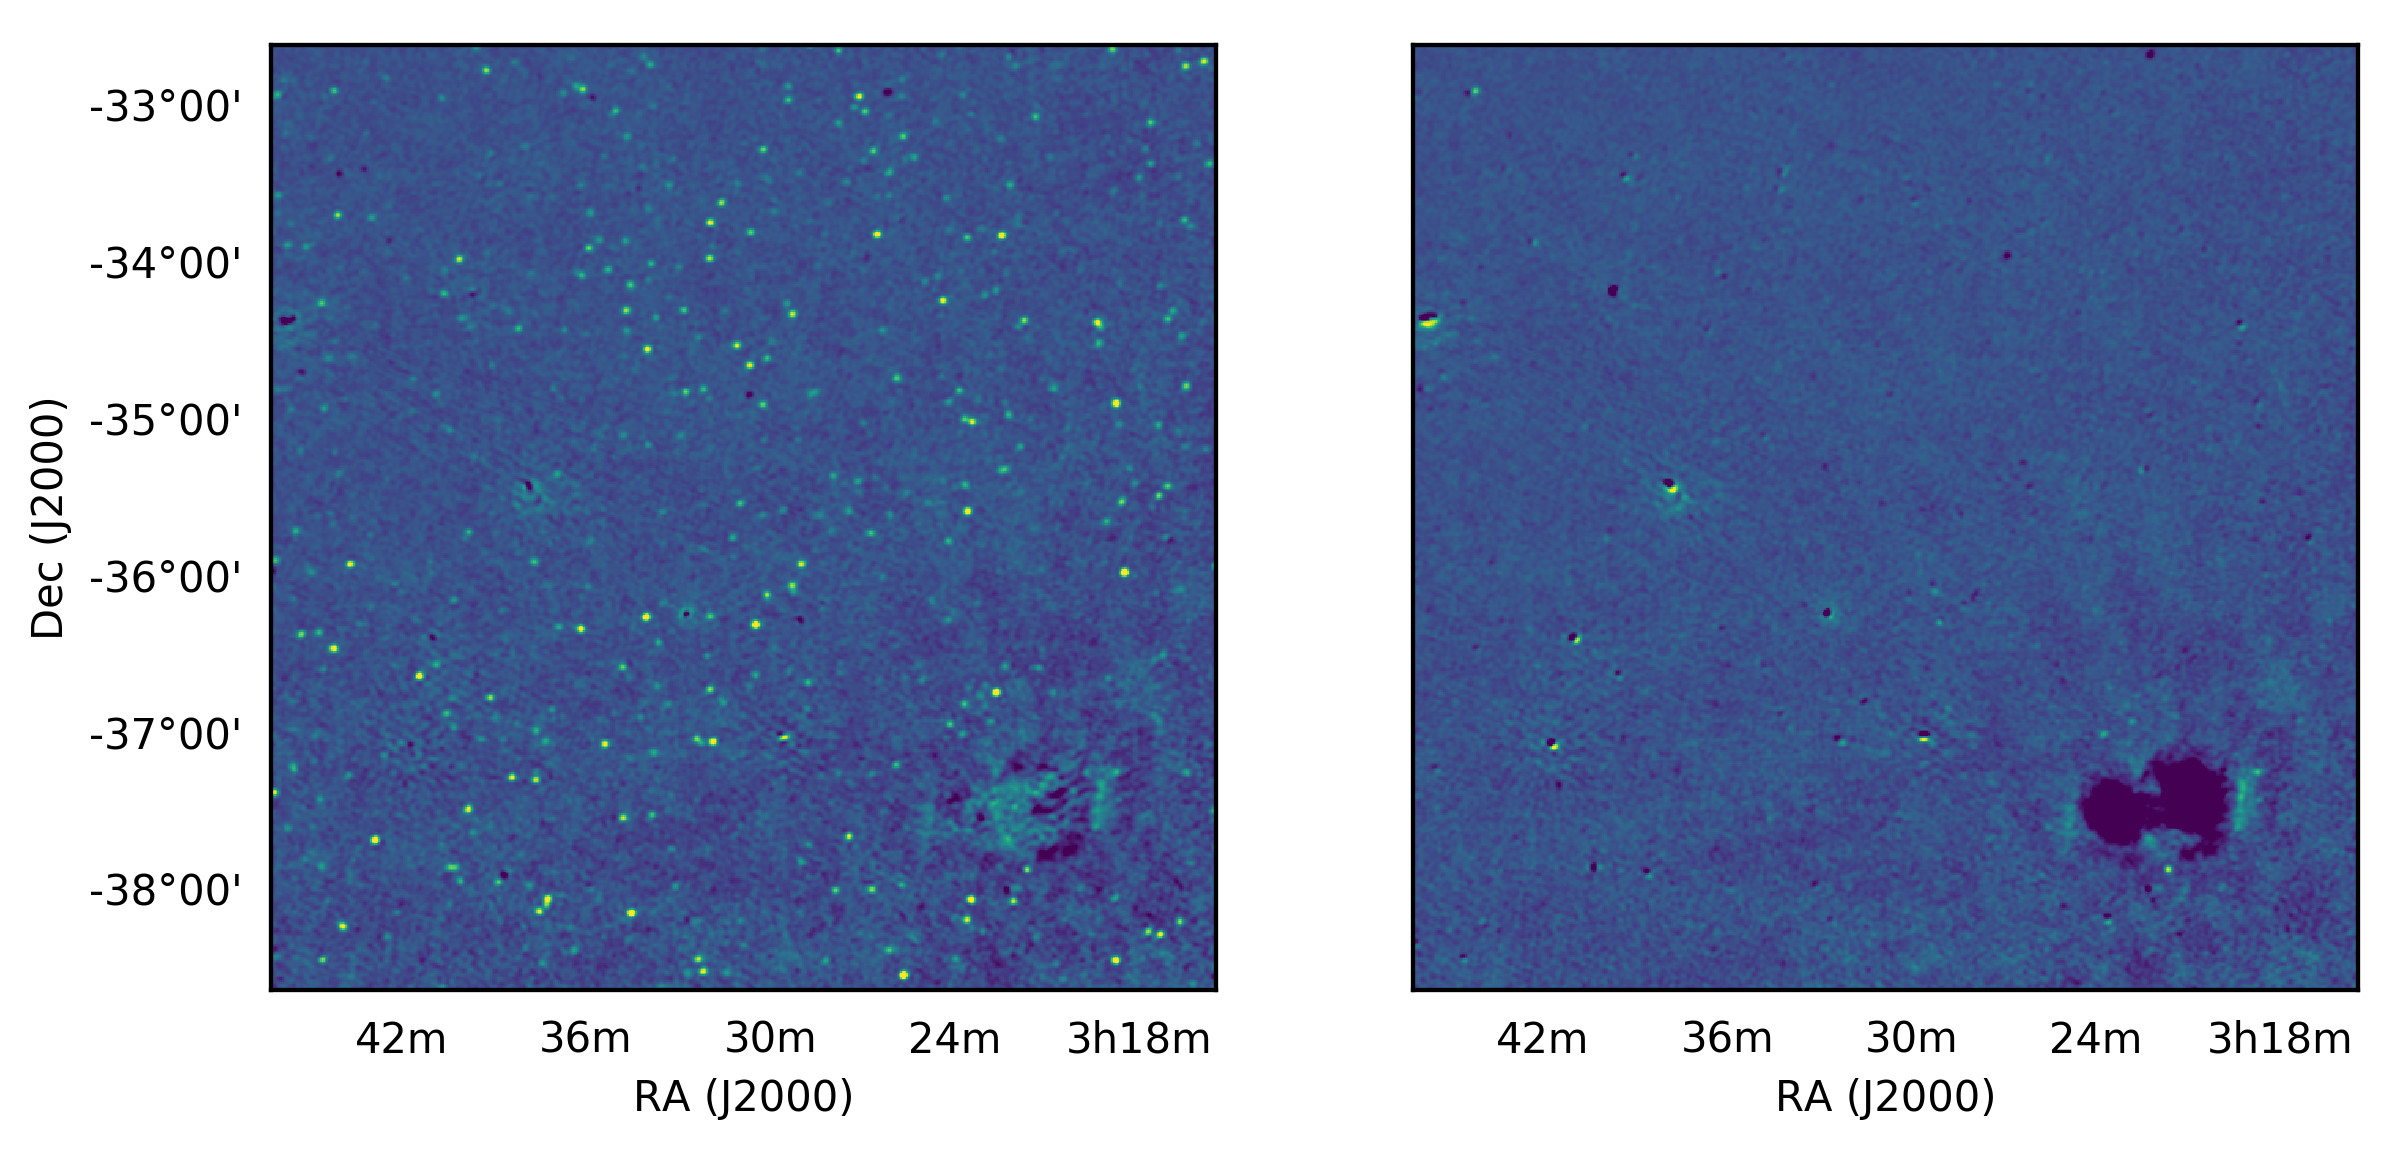
The jury is still out on which approach is better for now, but that is exactly what Jack is working on finding out.
Leave A Comment