This month’s media comes from Associate Professor Cathryn Trott who has recently published the closest results to finding the Epoch of Reionisation (EoR) signal to date. Due to the expansion of the Universe, different telescopes can see different times of the EoR (this is the effect of redshift). Cath used 110 hours of the best observations from the Murchison Widefield Array (MWA) to push closer to an answer on when and how the first stars and galaxies formed.
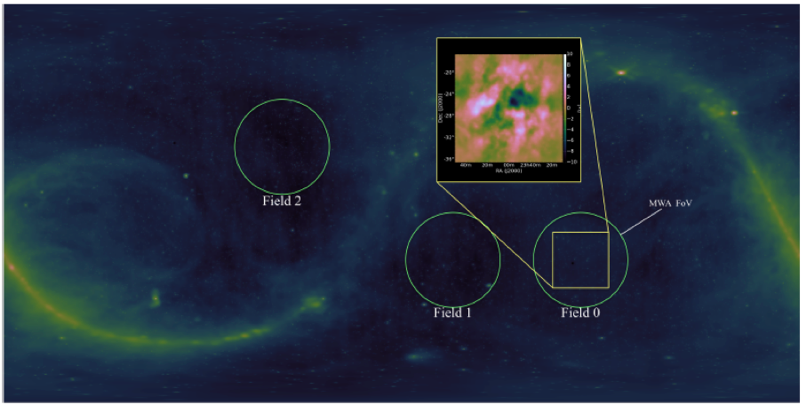
As PhD student Ronniy Joseph explained in the June 2019 Monthly Media (MM), there are certain places in the sky that are best to observe the EoR, where nearby and foreground radio sources don’t drown out the signal. The below image shows the fields of the sky best suited for the MWA to observe the EoR signal.

There are three fields best suited for the search for the EoR, visible to the MWA in the Southern Hemisphere; EoR0, EoR1 and EoR2. These avoid the emission of the Milky Way galaxy and have the fewest number of problematic radio signals.
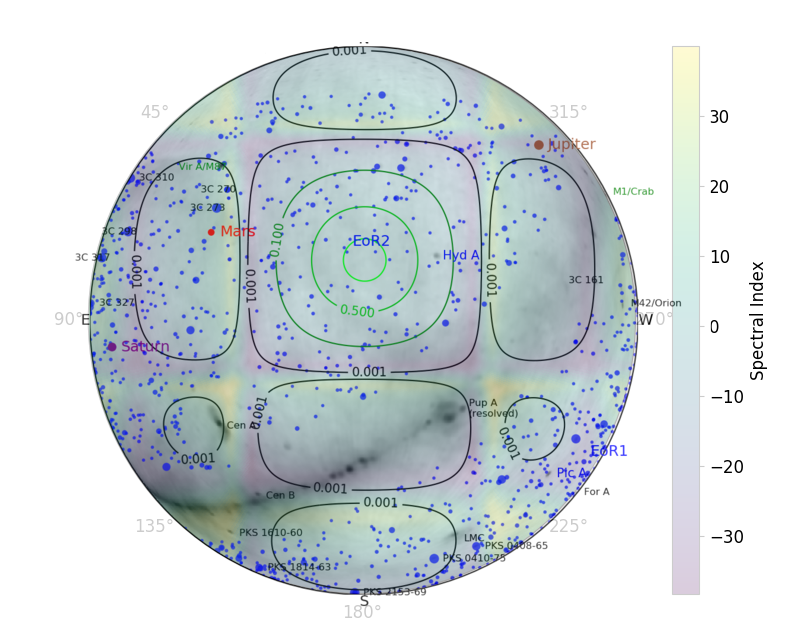
The way the MWA sees the sky and where it’s most sensitive is a huge part of finding the weak signal of the EoR, as outlined by Jack Line in the Decemeber 2018 MM. The below plot shows the view the MWA has of the whole sky, overlaid with the beam response – how sensitive the MWA is to certain parts of the sky. In this image, the MWA has been pointed to be most sensitive on the EoR2 field.

The EoR2 field is within the most sensitive part of the MWA’s field of view, with the Milky Way very close to the horizon. While the MW is not in the most sensitive part of the beam, it is still essential to understand how it is affecting what is seen of the EoR2 field.
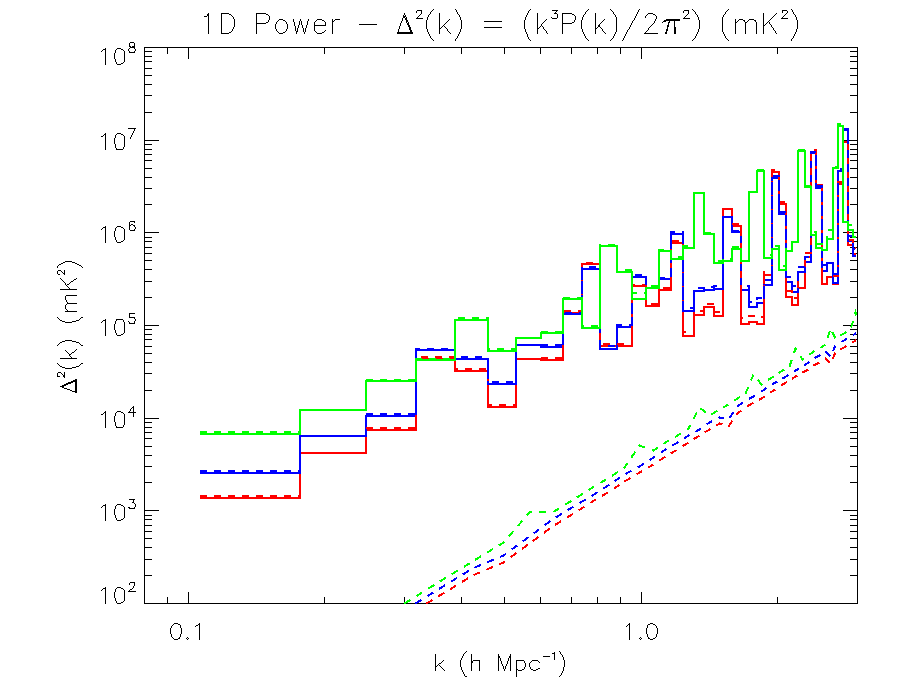
Combining the work of many of our MWA EoR group, as well as that of many other collaborating researchers and some high performance computing, has resulted in the below plot. This plot is used to characterise the size of the ionised bubbles that formed in the intergalactic medium around the first stars and galaxies, between 740 My to 830 My after the Big Bang (BB).

To obtain this 1D power spectrum, 110 hours of good MWA observations of the EoR0 field have been used. Red represents observations at redshift 6.5 (740My after the BB), blue at redshift 6.8 and green at redshift 7.1 (830My after the BB). The solid lines are the power measured, the dotted lines are the theoretical power of the EoR.
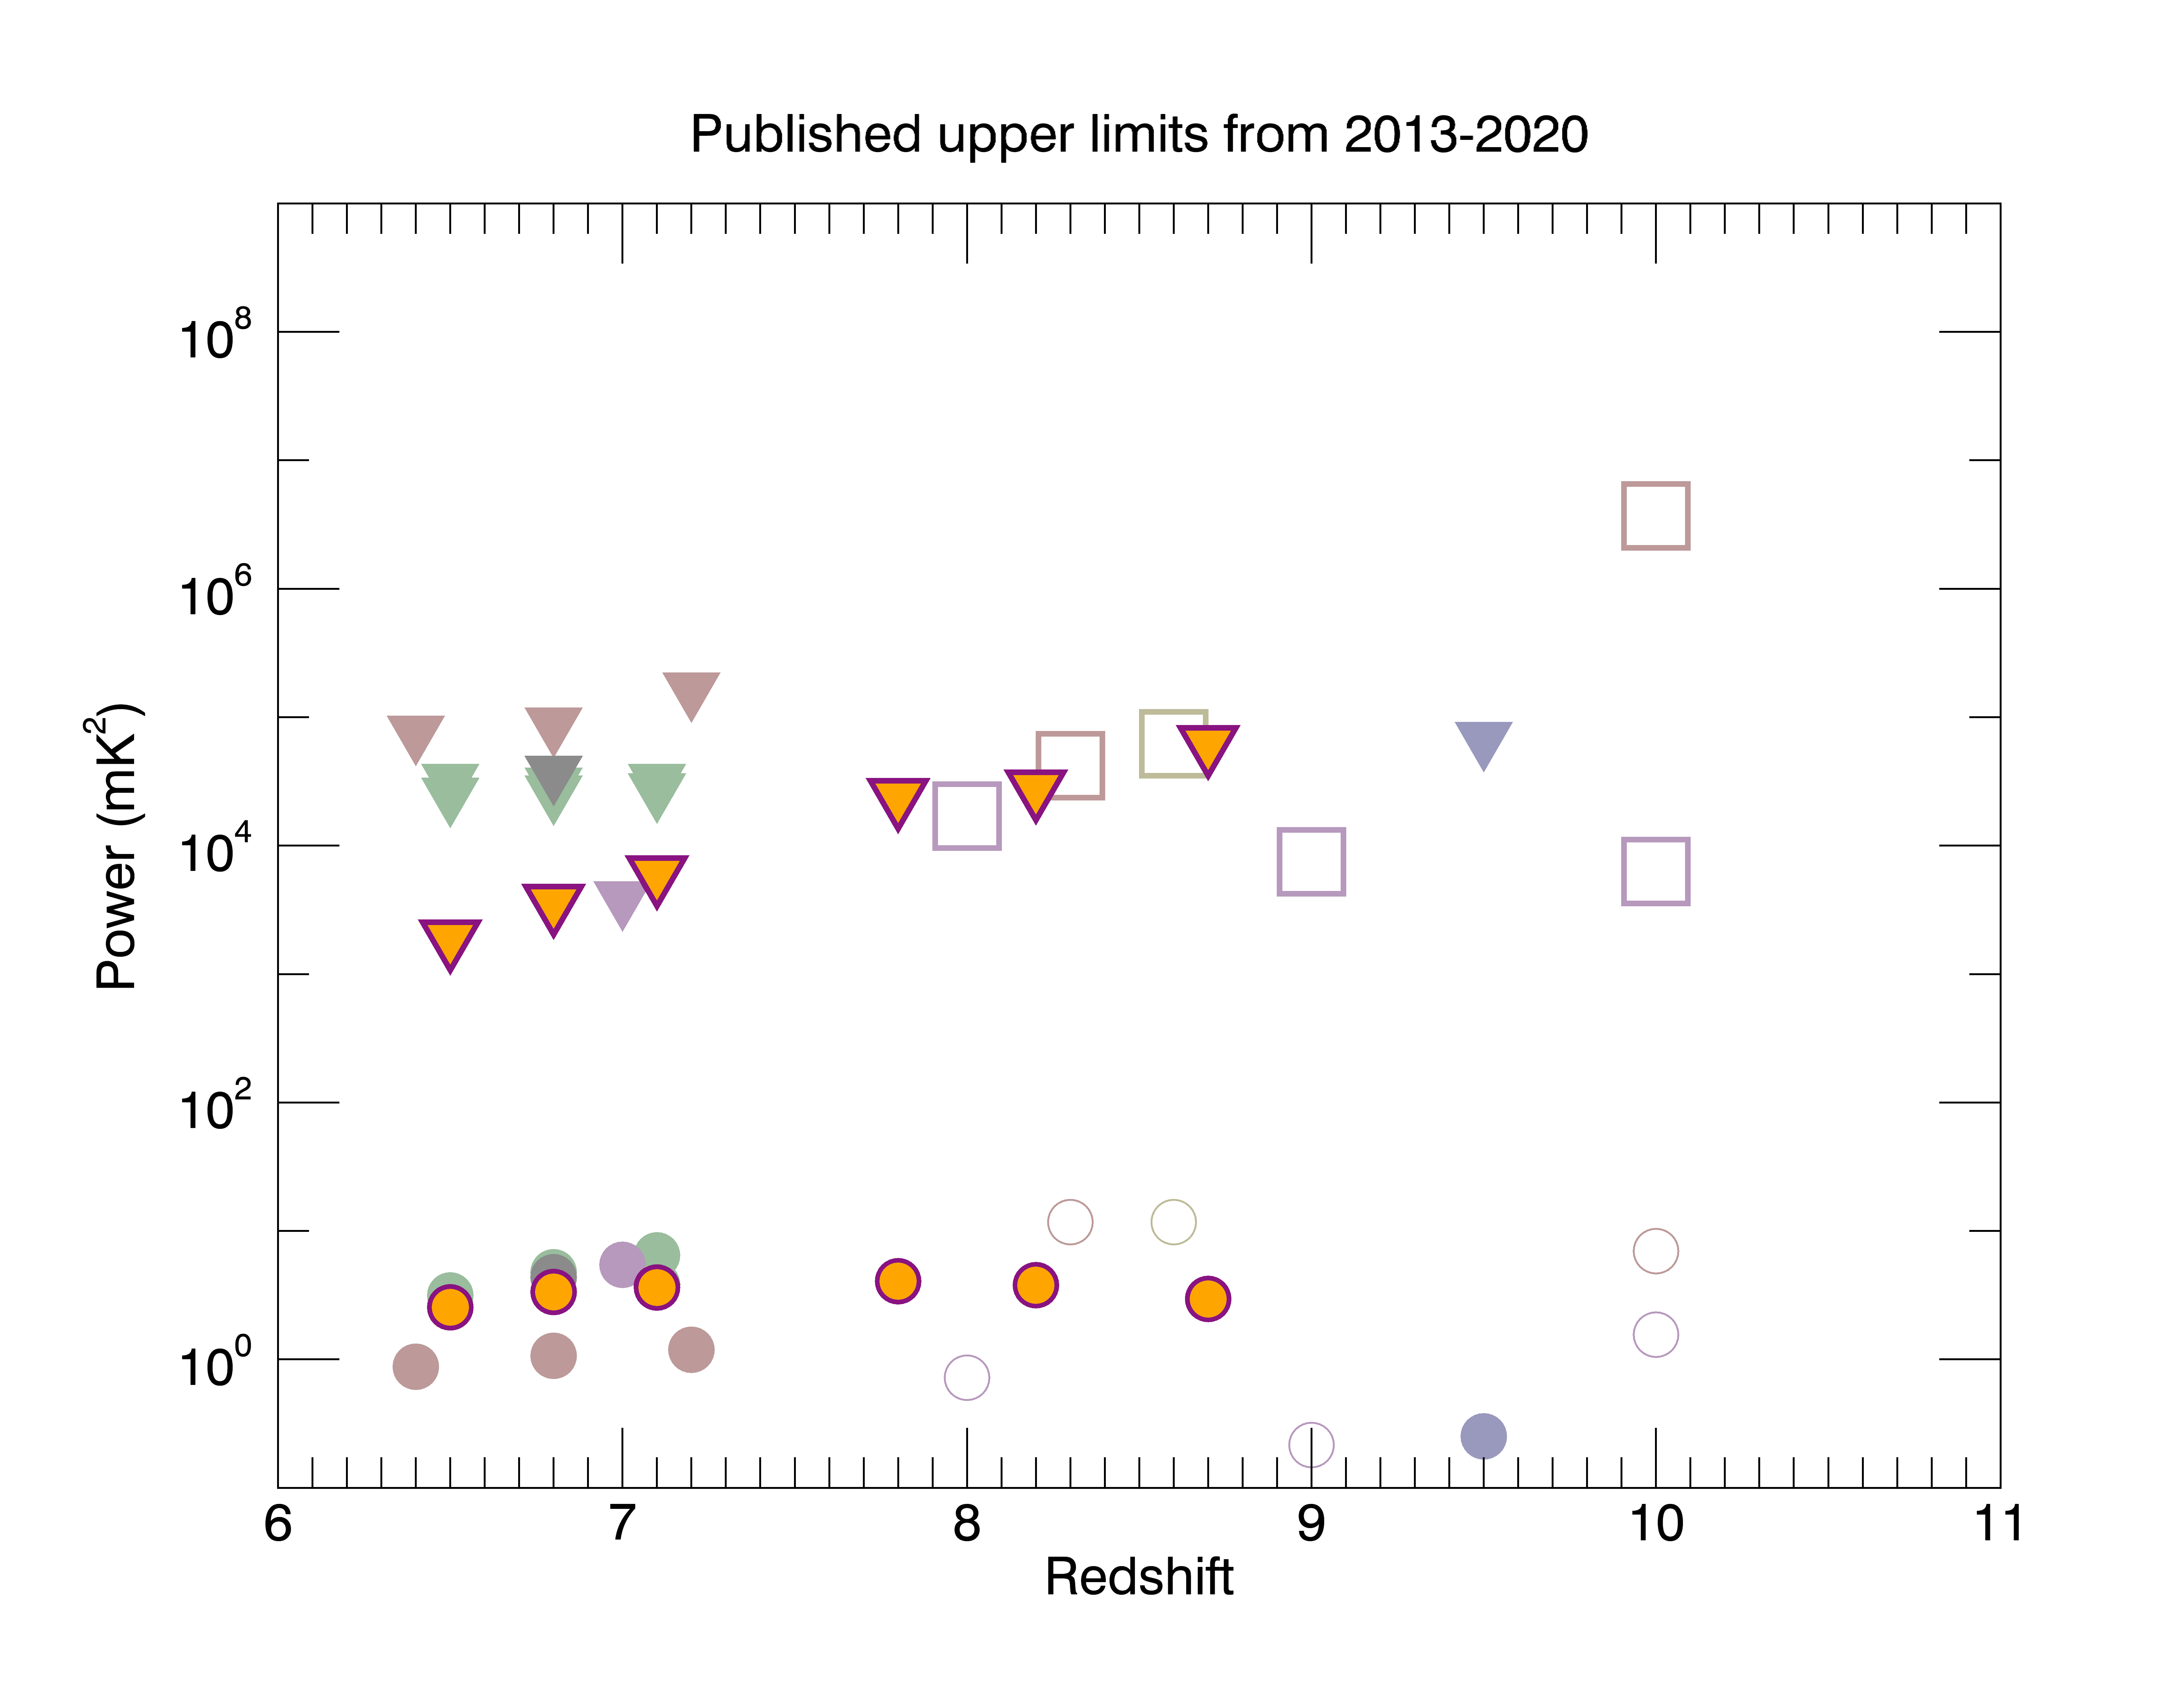
Comparing these newest results from the MWA with all the experiments since 2013 to search for the EoR signal gives the below plot, which show these new results have pushed the search closer than ever to the true EoR at low redshift.

The new results are shown as inverted orange triangles with a purple boarder. Circles represent the typical expected EoR power levels. Other points cover all other published upper limits on the EoR signal.