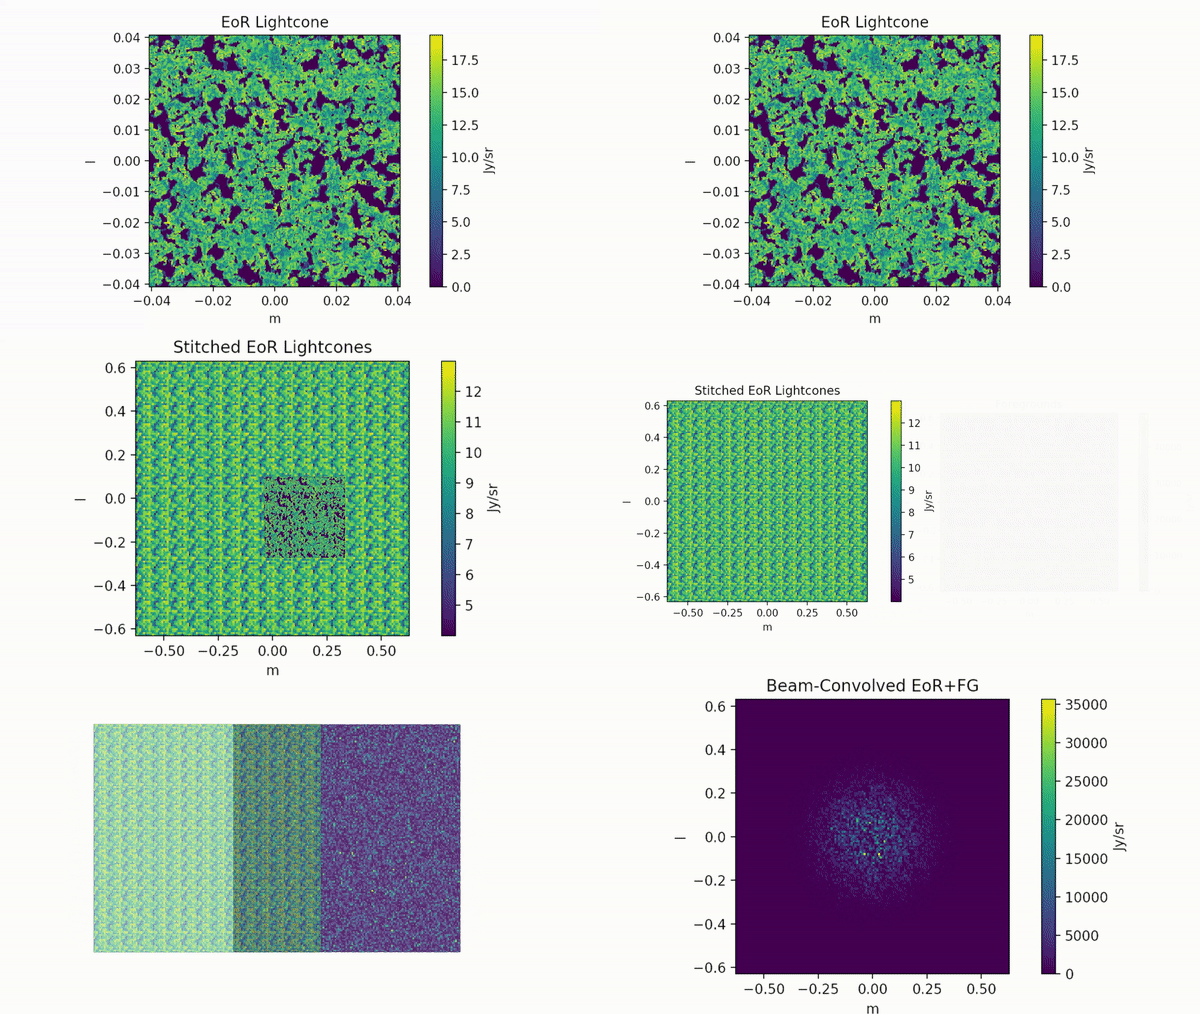
April 2019’s Monthly Media is a progression of images from PhD student Bella Nasirudin that shows the steps involved in simulating what the Murchison Widefield Array (MWA) will observe of the Epoch of Reionisation (EoR). Bella aims to understand the underlying physics of the EoR from the neutral hydrogen signal that was everywhere during the early Universe, which can be observed by radio telescopes. The first step is to generate the EoR signal (pictured below), which is actually due to the contrast of the bright sources and their surrounding area to the neutral hydrogen.

A simulation of what a 1 Gigaparsec x 1 Gigaparsec square of the EoR signal is expected to look like. 1 Gigaparsec = 30,000,000,000,000,000,000,000 kilometres.
The EoR signal travelled about 12.7 billion light years to reach our telescopes, and that huge distance makes a large simulated box of dimensions 1 Gigaparsec x 1 Gigaparsec appear as only one tenth of the field of view of the MWA. In order to overcome this, the box is repeated across the sky, stitched and coarsened together to match the angular size of the MWA beam (result pictured below).

Stitched EoR signal. In order for the EoR signal to cover the same angular size as an MWA observation, we need to stitch together the previous EoR image about 10 times across both axes.
The point source foregrounds (pictured below) are made up of extra-galactic sources, like star-forming galaxies and active galactic nuclei, and reside between our telescopes and the EoR signal. These foregrounds dominate the MWA images when searching for the EoR, being 10,000 – 100,000 times brighter.

A simulation of the foreground star-forming galaxies and active galactic nuclei, as would be seen in an MWA observation.
The faint EoR signal and the bright foregrounds signal are then combined with each other and then convolved with the beam of the MWA (pictured below).

The result of combining the EoR signal with the foregrounds image, then convolving that with the MWA beam. This is the expected MWA image.
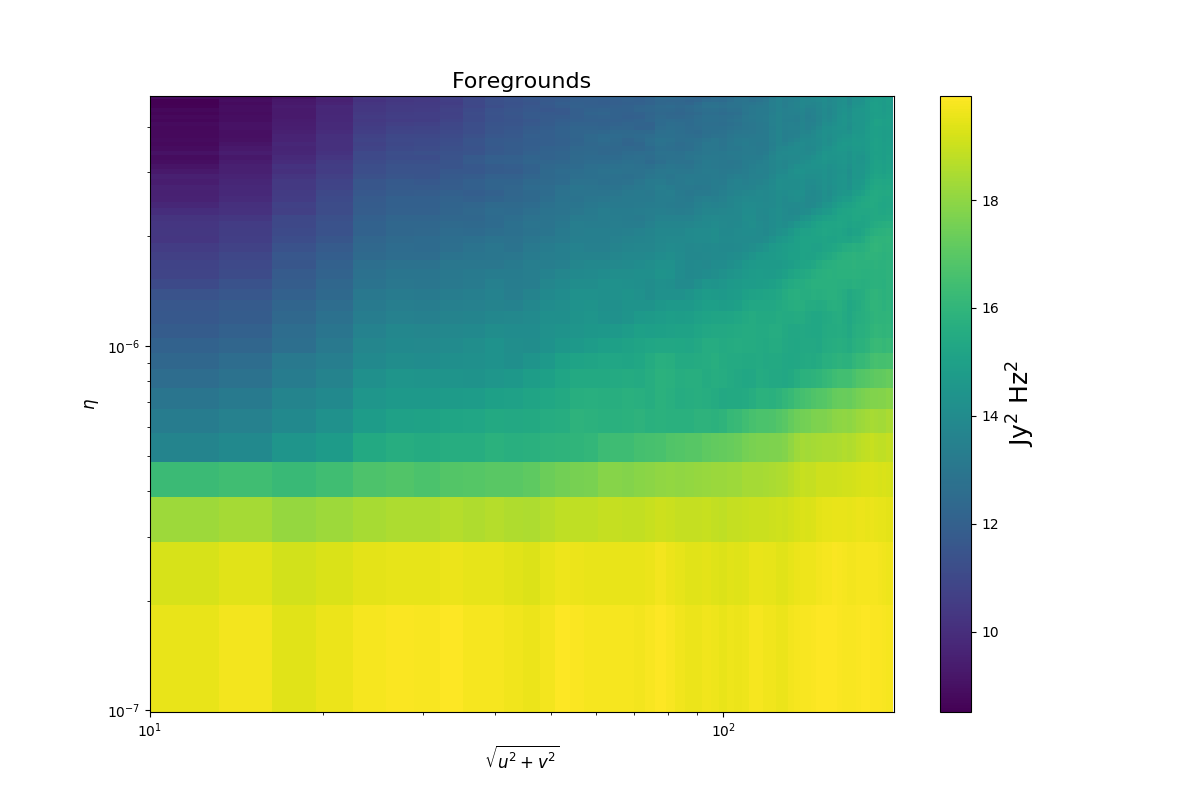
The last steps are a series of mathematical functions to get out the power spectrum (pictured below). The power spectrum shows on what spatial scales the power from an image comes from. In plain English, this means that if lots of signal is coming from something that looks large in the image (has a large angular size) and is nearby then the power spectrum plot will show brighter features in the lower-left areas.

The power spectrum. This shows the amount of power different spatial scales have for the simulated EoR signal, as seen by the MWA.
Leave A Comment