July 2019’s Monthly Media was from Dr Jack Line, showing how radio observations are processed to build up an image of a galaxy.
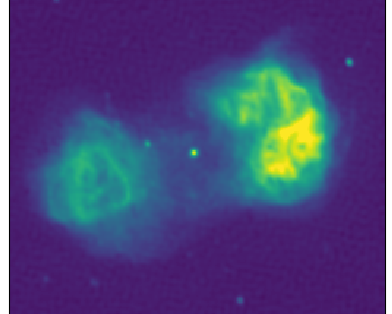
As shown in previous Monthly Medias, some galaxies emit radio waves, and can be huge on the sky, with complex structures. As we’re hunting a radio signal from the young Universe, during the Epoch of Reionisation (EoR) when the first stars switched on, these radio-loud galaxies are in the way and have to be removed. One such galaxy is Fornax A:

The complex and epic radio galaxy Fornax A. Image credit: Ben McKinley
When confronted with a galaxy such as Fornax A, how do we efficiently model the beastie, so we can remove it from our data? When fitting a model to data, we often use what are referred to as ‘basis functions’. You can think of them as a set of unique building blocks, that you can split any image up into, to build it back up from.
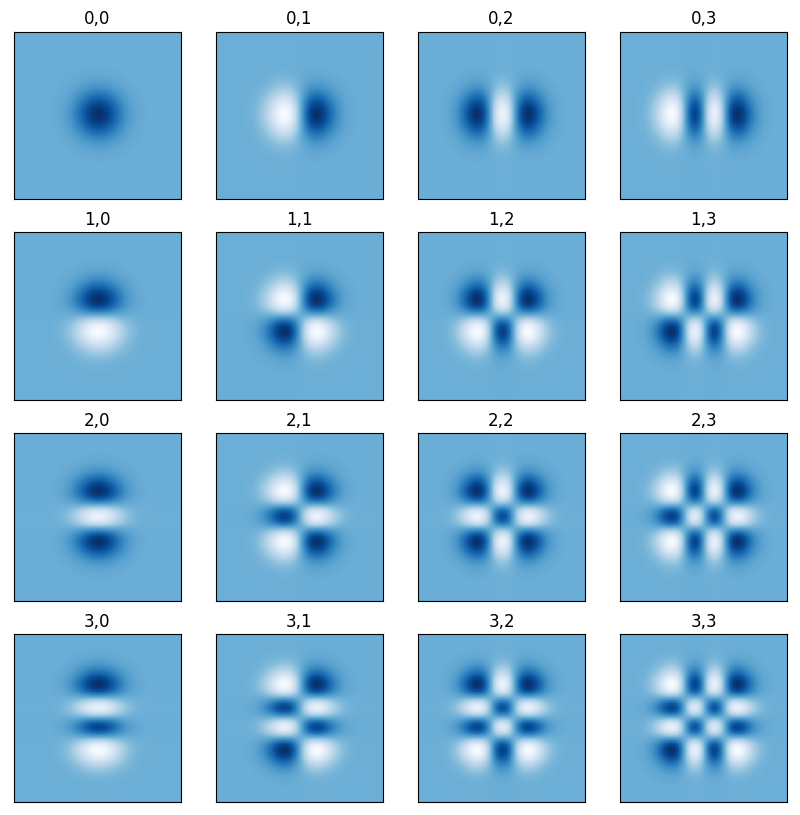
One useful set of basis functions is known as ‘shapelets’, which are two-dimensional, and labelled with two numbers, n1 and n2. You can see the first 16 of them below, with their n1,n2 labels above each image:

The first 16 shapelet basis functions. In each of these images, dark blue means a positive area, and white means a negative area.
As shown here, they contain set patterns, which give finer and finer detail as you go higher in n1,n2. They are quite complex, but this complexity means we can describe large and fiddly structures with small amounts of information.
To model a galaxy like Fornax A, we end up using around 3,500 shapelets in total (so 3,500 images like those shown in Figure 2). This might sound large, but considering the above image of Fornax A has over 30,000 pixels, this ends up being a more efficient way of describing the information when we create models for calibration with a telescope like the MWA.
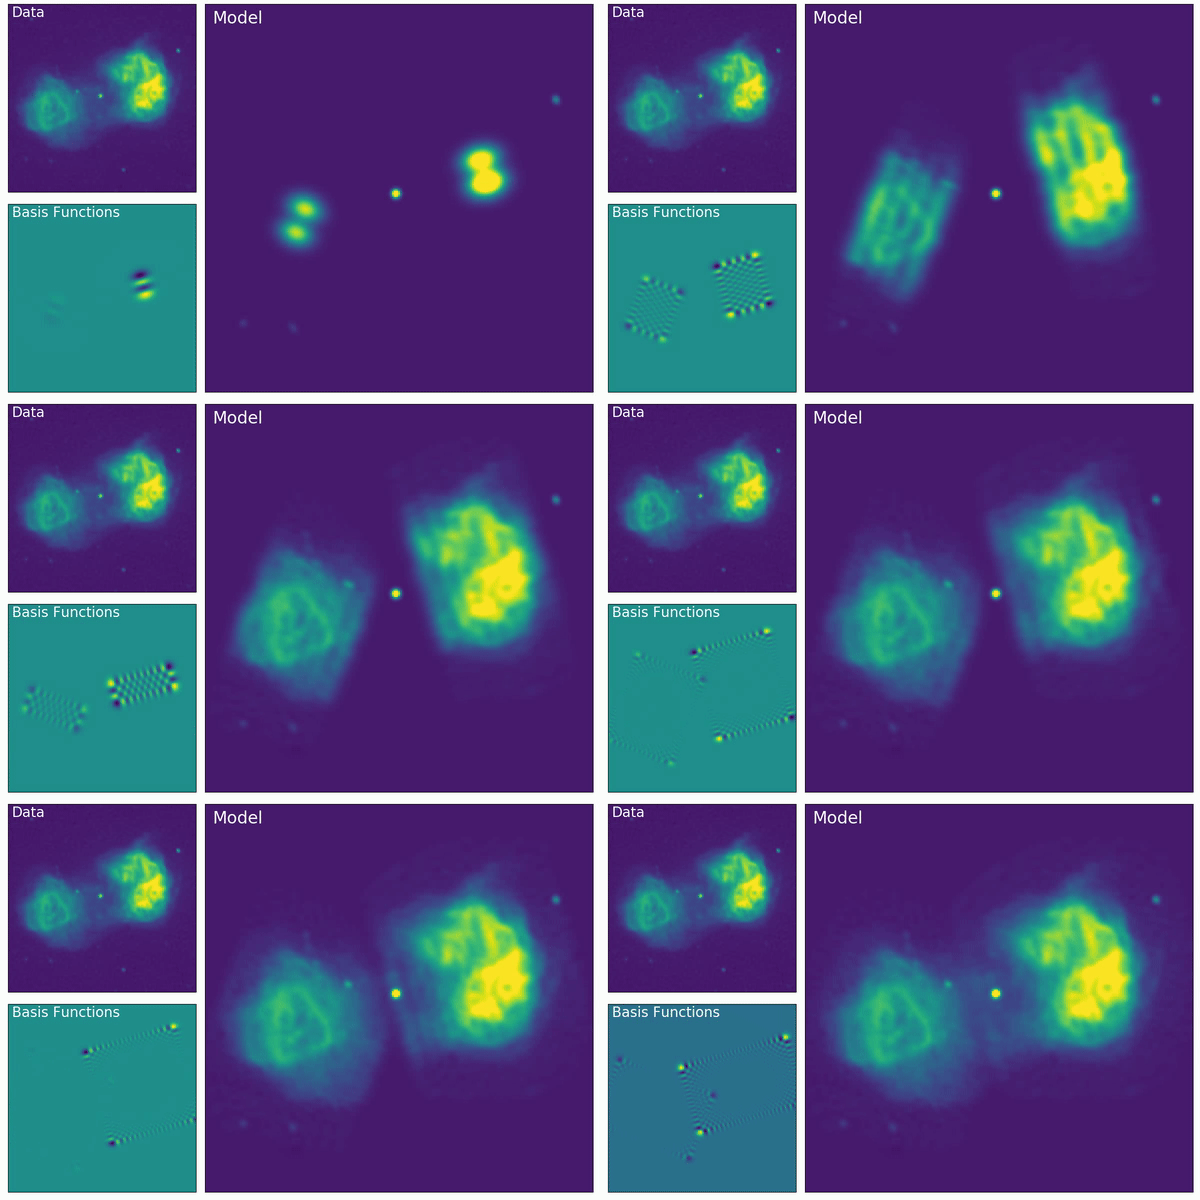
The nuts and bolts come down to finding a single number for each shapelet basis function to multiply by, such that when you sum together all the basis functions, you create an image that matches the original. Once you’ve done this fitting, you can then build up an image of your galaxy basis function by basis function, as shown below.

Building a radio-galaxy using shapelet basis functions. We want to model the data, shown in the top left. Here we actually make two separate models, one each for the left and right ‘lobes’. In each frame of the gif, we add a new basis function (bottom left), to the overall model (right). You can see as time goes, Fornax A slowly takes shape. Eagle eyed viewers will see there are already 4 dots in the model at the start; it’s more efficient to add those 4 dots separately, rather than model them with shapelets.
Leave A Comment