In past monthly media (see March and April 2019), we have shown an image called the power spectrum. To celebrate National Science Week this month, PhD candidate Ronniy Joseph explains why we use power spectra in the search for the Epoch of Reionisation instead of looking at images of bubbles.
You may have already learned that the radio signals from the EoR are extremely faint compared to bright foreground galaxies close to us (about 10,000x fainter). On top of that we are also limited by the sensitivity of our radio telescopes. The Murchison Widefield Array (MWA) with over 4,000 antennas would still several years of full time observing to directly capture an image of the formation of the first stars and galaxies, unlike the Square Kilometre Array (SKA).

Viewing into the Universe’s history from Earth with the MWA. Earth Image: NASA, HDF Image Credit: NASA/ESA/HUDF09 Team
Instead of staring at the sky for decades or waiting for the SKA to be built we choose to use less time and instead use a mathematical tool called the power spectrum. Before we go into explaining what it is, let’s first look at a very important property of the Universe we live in.
When we look at the Universe at the largest scales, we see that the universe looks more or less the same at different locations (uniform) and in different viewing directions (isotropic). This is particularly useful when you’re trying to detect a signal that’s fairly weak. This means that if we look at a piece of volume in the Universe, it does not really matter in which direction we look because it’s properties should be the same.

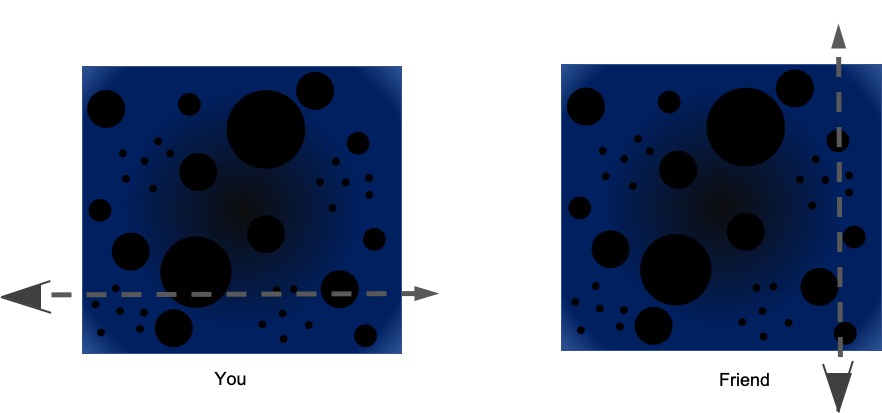
You and a friend travelling through the Universe during the EoR in different directions, keeping track of the size and number of ionised ‘bubbles’ you find along the way. If you travel far enough, you will count the same number and sizes of bubbles, because the Universe is uniform and isotropic.
Imagine yourself and a friend travelling through a cube of the Universe in two completely different directions, as shown in the above figure. You decide to keep track of what you find along the way: the number of bubbles of a certain size. You’d find exactly the same number if you travel far enough. It is this property that enables us to spend less time collecting radio waves and use the power spectrum. Instead of looking at how bright the hydrogen signals are at a certain location in the Universe, we take that entire volume we’re observing and look at how much the signal changes as a function of so-called scale size.

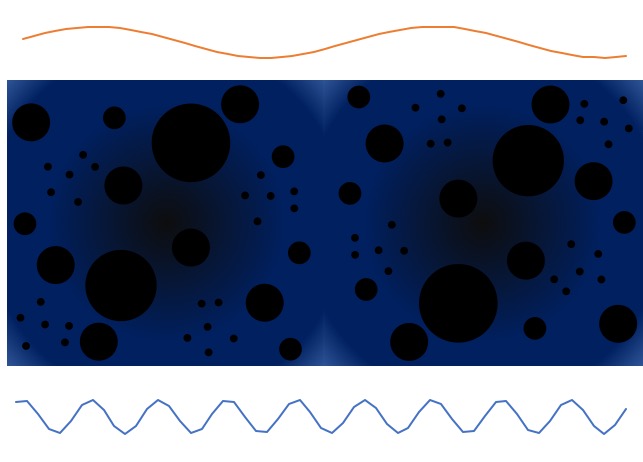
Looking at a large section of the Universe during the EoR, there are different numbers of large and small bubbles, corresponding to long and short size-scales in the data our telescopes collect. The ratio of long to small scales tells us about the structure of the Universe where and when we’re looking at.
Does the signal change fast on short scales, or does the signal change slow on large scales? Having lots of tiny ionised bubbles (early stage) would mean the signal changes more at the small scales. Later on when the bubbles overlap (late stage) we’d expect changes on the larger scales. The above figure offers a potential snapshot of the ratio of the small to large bubbles during the EoR.
By calculating the power spectrum we overlay these wavelike functions, and determine how well they describe changes in the signal. We do this for various waves in all different directions (3D-Power Spectrum). And because the Universe looks the same in all directions, we can sum up the contributions for waves of the same shape in different viewing directions. This allows us to condense this 3D wave information into 2D and even down to 1D. This enables us to add all of that signal in the entire volume we’re observing making us even more sensitive without observing for many more years.
Leave A Comment